You can use the Visual Area options to create new visual areas, rename or delete your visuals, visual areas, and discovery areas, or change the "scope" of your visual areas and visuals. That is, to change which cells are included in your current visual area or are currently visualized in a visual.
Important: This view allows Tabulate Pro users to view and manage visuals, visual areas, and discovery areas and allows Tabulate Lite users to view and manage visual areas and discovery areas only.
Editing your Visuals and Visual Areas
Opening the Editor
From the Tabulate ribbon, click the Visual Area dropdown list to show the options:
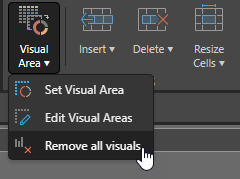
Set Visual Area
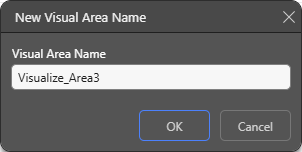
The Set Visual Area option opens the New Visual Area Name dialog. If you enter a name (without spaces) and click OK, the currently selected cells are saved as a new visual area.
Note: You can only create visual areas using this dropdown list. Visualizations are created when you click Visualize on the context menu and discovery areas are created when you import discovery data into a tabulation.
Edit Visual Areas
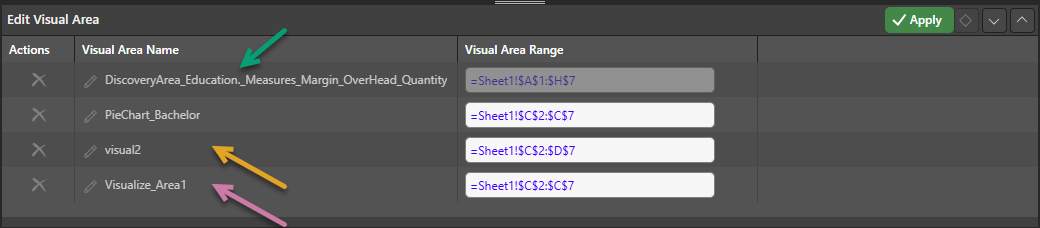
The Edit Visual Area panel that opens at the bottom of the page can be used to view the visuals, visual areas, and discovery areas associated with the open workbook. It can also be used to edit those items:
Actions
- Click Delete to permanently delete the visual, visual area, or discovery area.
Visual Area Name
- Click Edit to change the name of your visual, visual area, or discovery area. Your new name must not contain any spaces, and must allow you to recognize your items.
Visual Area Range
The Visual Area Range is a reference formula that describes the grid of cells that is defined as a discovery area or a visual area, or that defines the scope of a visual (i.e. that indicates which cells are being visualized as a chart). The structure of the formula is = followed by the sheet name (Sheet1) and then the reference describing the grid of cells. If you select the Visual Area Range, the cells it refers to will also be selected on the tabulation canvas.
You can use the Visual Area Range field to change the "scope" of your visual or visual area:
- Change the scope of your visual area. This may change which cells are embedded in presentations, publications, or illustrations or which cells are used as a data source.
- Change the scope of your visual. This will change the visual to either include more or fewer cells in its visualization. For example, if your visualization is a Pie Chart that visualizes all values in column C in your tabulation. you can change the range formula to include column D instead or as well as column C.
You cannot change the Visual Area Range for your Discovery Area. A Discovery Area is created when you drag your discovery into your tabulation and create a "live" link between the two files. It includes all of the cells that are present in the source discovery.
Remove all visuals
- Click Visual Area > Remove all visuals to delete all of the visuals from the currently open tabulation.
Other topics
- Creating Tabulate Visuals
- Adding Visual Areas
- Copy Discovery Data into your Tabulation (Create Discovery Area)